What Makes a Song Likeable?
Analyzing Spotify’s top tracks using Data Visualization

Photo by sgcreative on Unsplash
Motivation
The debate on whether choice in music is subjective or objective is an age-old argument. Some people, like Jack Flemming in his opinion column, fall on the objectivity side of the argument saying “Using subjectivity in music analysis tends to trivialize it.” He goes on to say that like other art forms, we need to have a basis of judgement for music as well. In the article Objectivity vs. Subjectivity in Music: The Ultimate Guide and Solution, the author, “Carcinogeneticist” tries to give a balanced view saying both arguments have their merits and demerits. He puts forth a theory that, “The truth is that objectivity and subjectivity are interrelated and possibly exist on a spectrum”. Subjectivity is nearly impossible to analyze. But if subjectivity is removed from the equation, all artistic merit can be rationally dissected.
But I wanted to analyze another aspect of a song — the popularity. Irrespective of the quality of the song or the talent involved in composing and playing it, it is nearly impossible to know what makes a song popular. As a musician, I have always been curious about what really makes a song likeable to the masses. Spotify is one of the leading music streaming apps of today with more than 83 million paid subscribers as of June 2018. They compile a yearly list of Top Tracks based on the number of times the songs were streamed by users. To find the answer, I decided to use Data Visualization to find patterns and trends in the list of Top Tracks of 2017, curated by Spotify.
Audio Features
For every track on their platform, Spotify provides data for thirteen Audio Features. TheSpotify Web API developer guide defines them as follows:
Danceability: Describes how suitable a track is for dancing based on a combination of musical elements including tempo, rhythm stability, beat strength, and overall regularity.
Valence: Describes the musical positiveness conveyed by a track. Tracks with high valence sound more positive (e.g. happy, cheerful, euphoric), while tracks with low valence sound more negative (e.g. sad, depressed, angry).
Energy: Represents a perceptual measure of intensity and activity. Typically, energetic tracks feel fast, loud, and noisy. For example, death metal has high energy, while a Bach prelude scores low on the scale.
Tempo: The overall estimated tempo of a track in beats per minute (BPM). In musical terminology, tempo is the speed or pace of a given piece, and derives directly from the average beat duration.
Loudness: The overall loudness of a track in decibels (dB). Loudness values are averaged across the entire track and are useful for comparing relative loudness of tracks.
Speechiness: This detects the presence of spoken words in a track. The more exclusively speech-like the recording (e.g. talk show, audio book, poetry), the closer to 1.0 the attribute value.
Instrumentalness: Predicts whether a track contains no vocals. “Ooh” and “aah” sounds are treated as instrumental in this context. Rap or spoken word tracks are clearly “vocal”.
Liveness: Detects the presence of an audience in the recording. Higher liveness values represent an increased probability that the track was performed live.
Acousticness: A confidence measure from 0.0 to 1.0 of whether the track is acoustic.
Key: The estimated overall key of the track. Integers map to pitches using standard Pitch Class notation . E.g. 0 = C, 1 = C♯/D♭, 2 = D, and so on.
Mode: Indicates the modality (major or minor) of a track, the type of scale from which its melodic content is derived. Major is represented by 1 and minor is 0.
Duration: The duration of the track in milliseconds.
Time Signature: An estimated overall time signature of a track. The time signature (meter) is a notational convention to specify how many beats are in each bar (or measure).
Dataset
I found that the data I needed from Spotify was already available as a dataset on Kaggle as "Top Spotify Tracks of 2017" by Nadin Tamer. I checked the data and found that it was already sanitized and had no validation errors. It lacked a field for the rank of the song, which I added.
Initial Explorations
Out of the above-mentioned parameters, Mode is a binary value of either 1 or 0 denoting the modality of the track (Major or minor), and Key is an absolute integer value denoting the scale of the song (C =0, C# = 1, etc.) Hence, I left these 2 parameters out for and created a scatterplot matrix with the remaining 11 parameters.
I created the scatterplot matrix with two main intentions:
- See if there are any relationships between parameters.
- Find obvious trends and patterns so as to better identify focus areas.
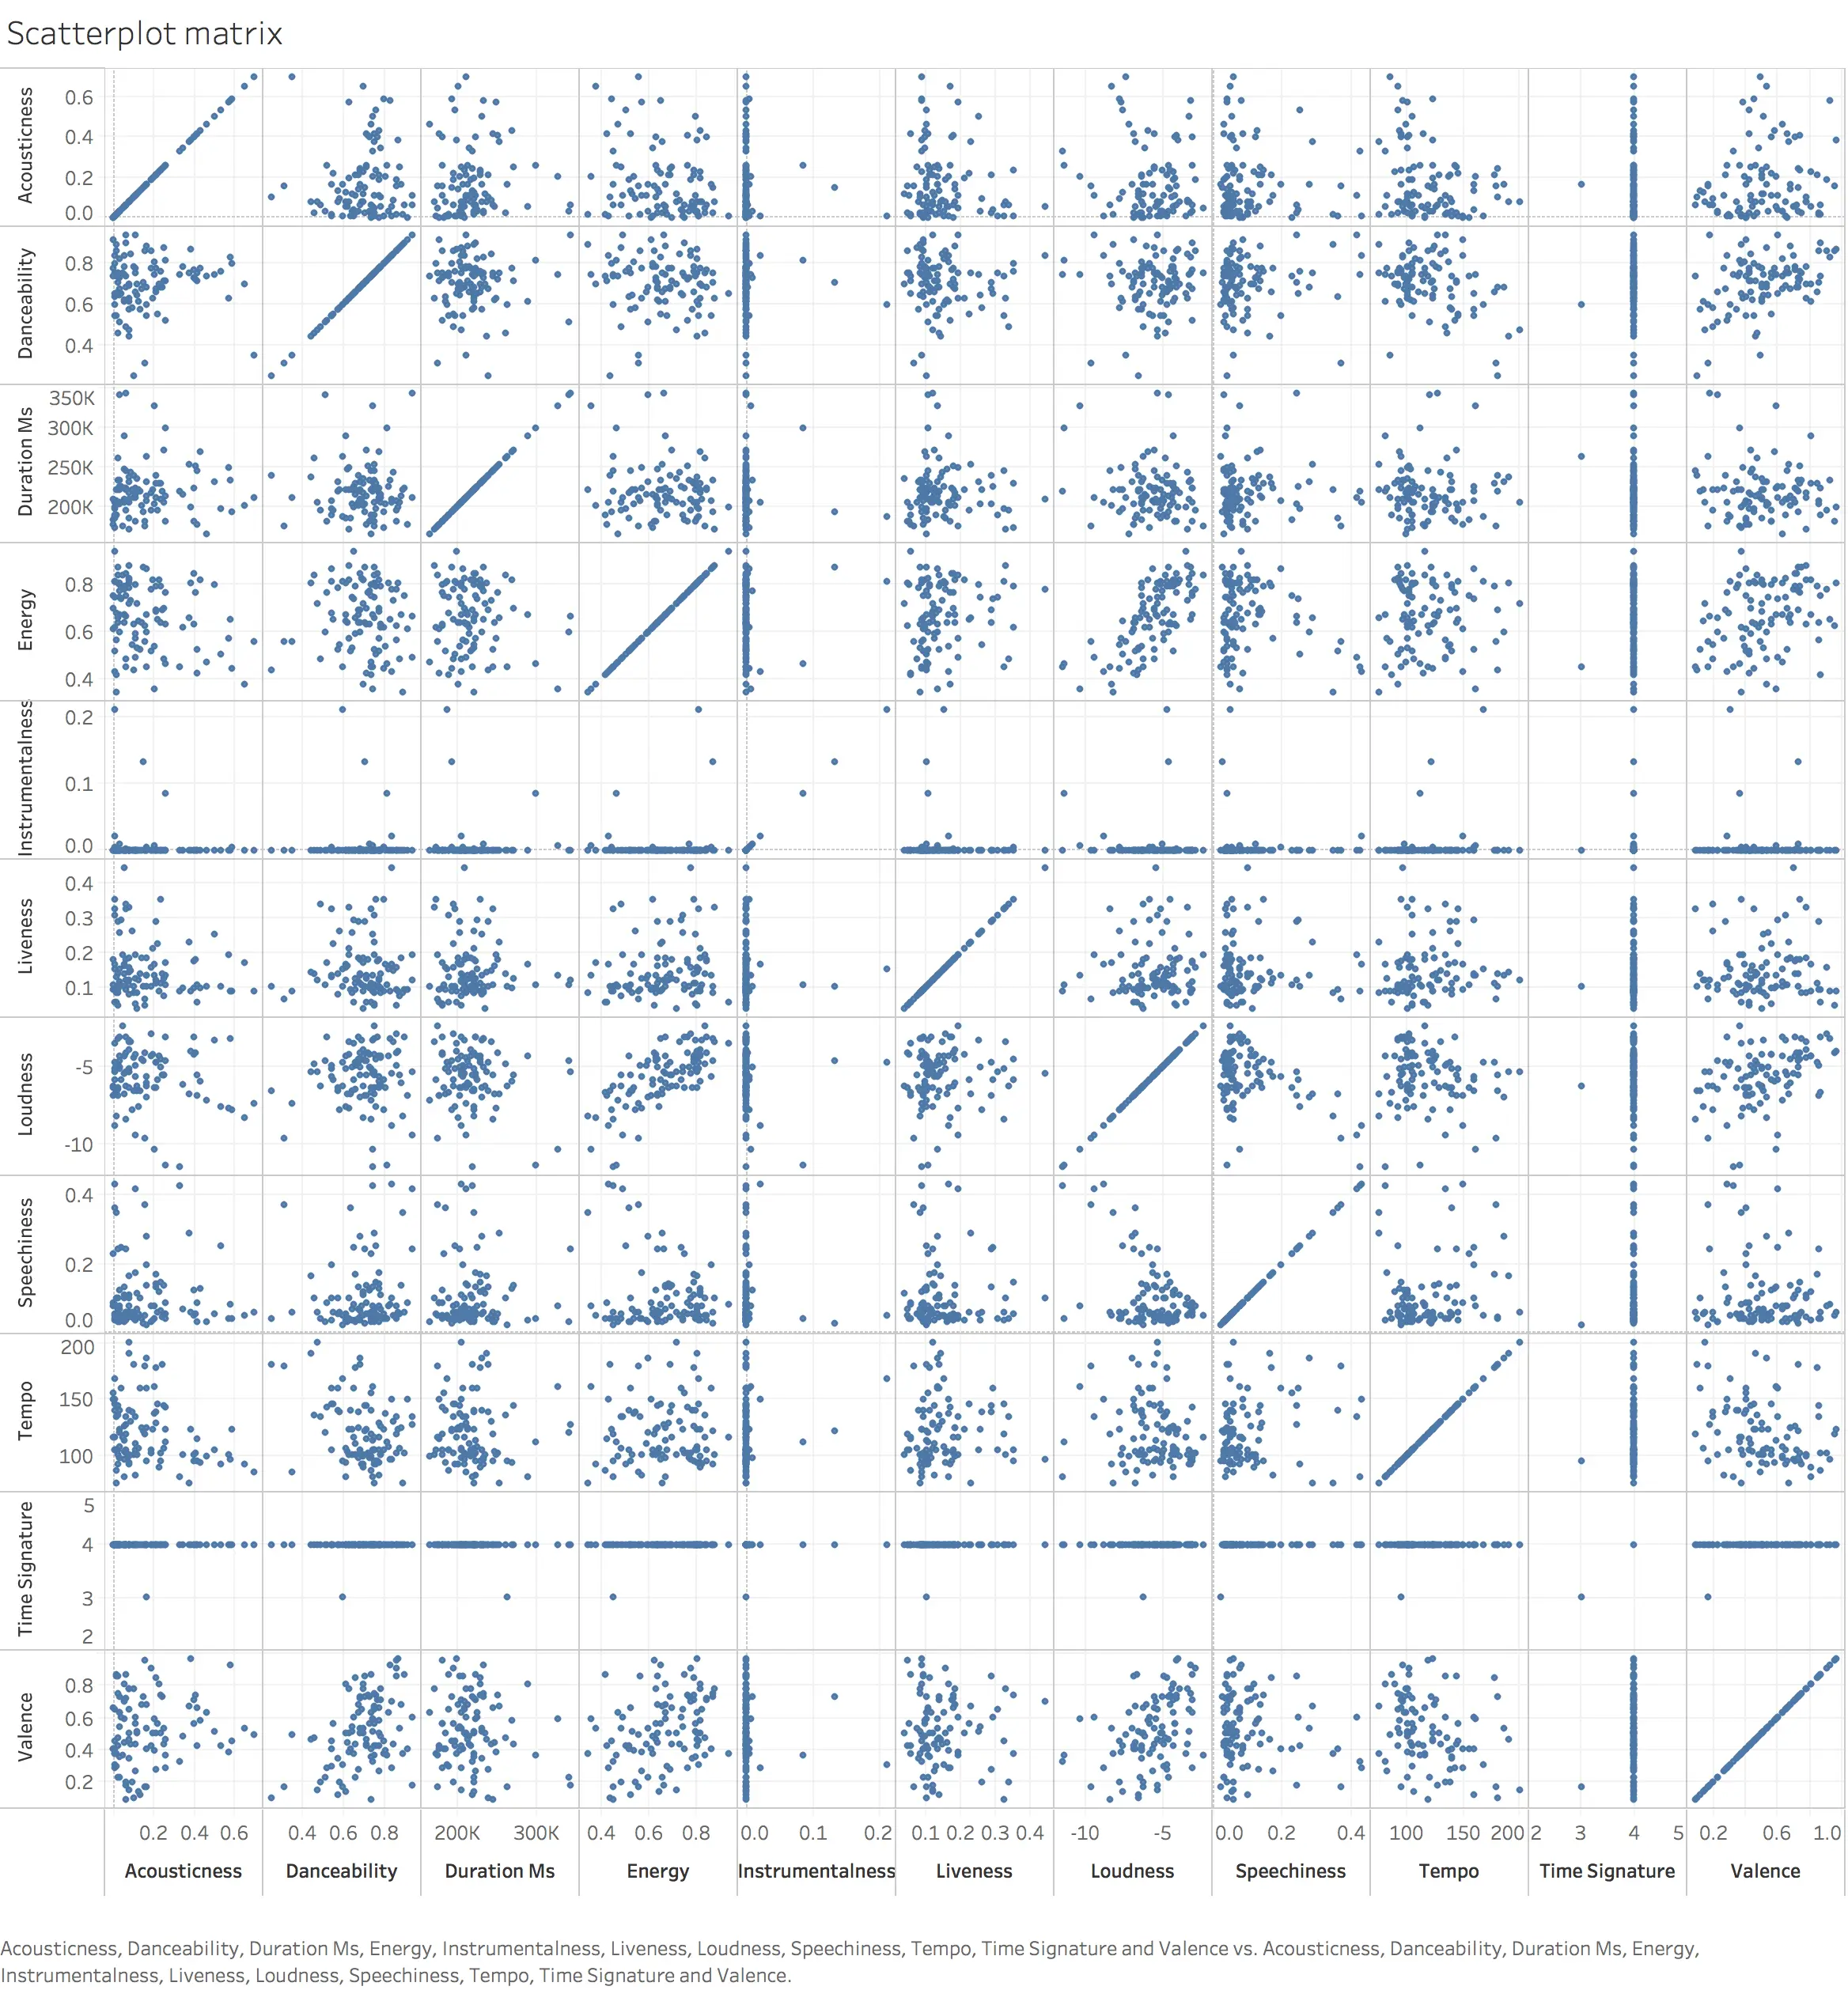
Scatterplot matrix of the Audio Feature parameters
A few observations from the scatterplot are as follows:
- Almost all the songs seem to have a common Time-Signature of 4/4. Hence, I dropped this parameter from consideration.
- Most of the songs seem to have a value close to or equal to 0 for Instrumentalness. Again, dropping the parameter.
- Energy and loudness seem highly proportional.
- Valence seems to be proportional to danceability, energy and loudness.
From the definitions of the parameters in the API guide, Tempo and loudness seem to be low-level parameters which are used to calculate other higher level parameters like valence, energy, and danceability. Hence I will discount tempo and loudness from the next steps for the sake of reducing similar parameters. I also dropped the duration parameter since most tracks pretty much seem to be around the 200s or 3:20 minute mark.
Initial Sketches
Now that I was left with just six parameters, I sketched out a few ways to explore how to make sense of the data such as density plots or just plotting variations in each parameter against rank. But none of these would result in an appealing visualization that would convey the information to the audience in an engaging manner.

While I was looking for ways to represent multiple parameters, I remembered Radar Charts!
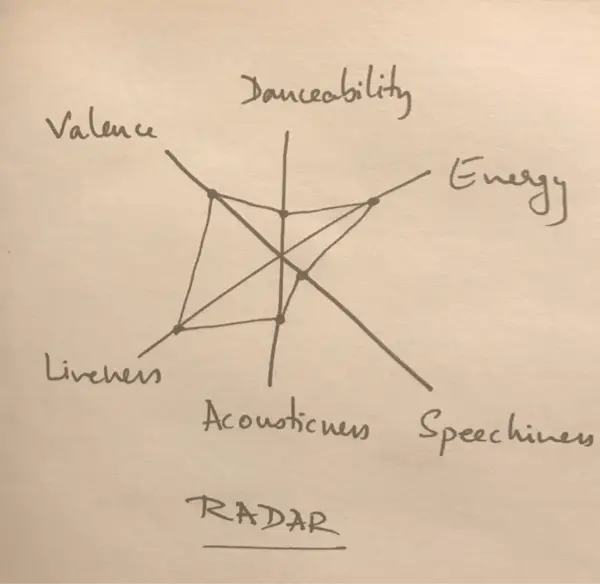
They were simple enough to understand, and one could get an idea of all six parameters at a glance. It was just what I needed!
Implementation
I initially implemented it on Tableau but it looked quite boring. Visual appeal was an important aspect of my project. So, as I scoured the web for ways to not only implement a radar chart, but to do it in a beautiful manner, I chanced upon Nadieh Bremer’s blog Visual Cinnamon and her article about her redesign of D3’s radar chart and I knew this was it! The implementation details of her redesign, under the MIT license, can be found at http://bl.ocks.org/nbremer/21746a9668ffdf6d8242.
The blog post was from 2015 and hence the code was for a much older version of D3.js(v3). I have dabbled in Javascript before but was completely new to D3 so it took a bit of wrangling to update APIs and get the code to work on v5. I also had to spend some time formatting the data.
I set it up to show one song at a time from Rank 1 to 100. Time for the first look..
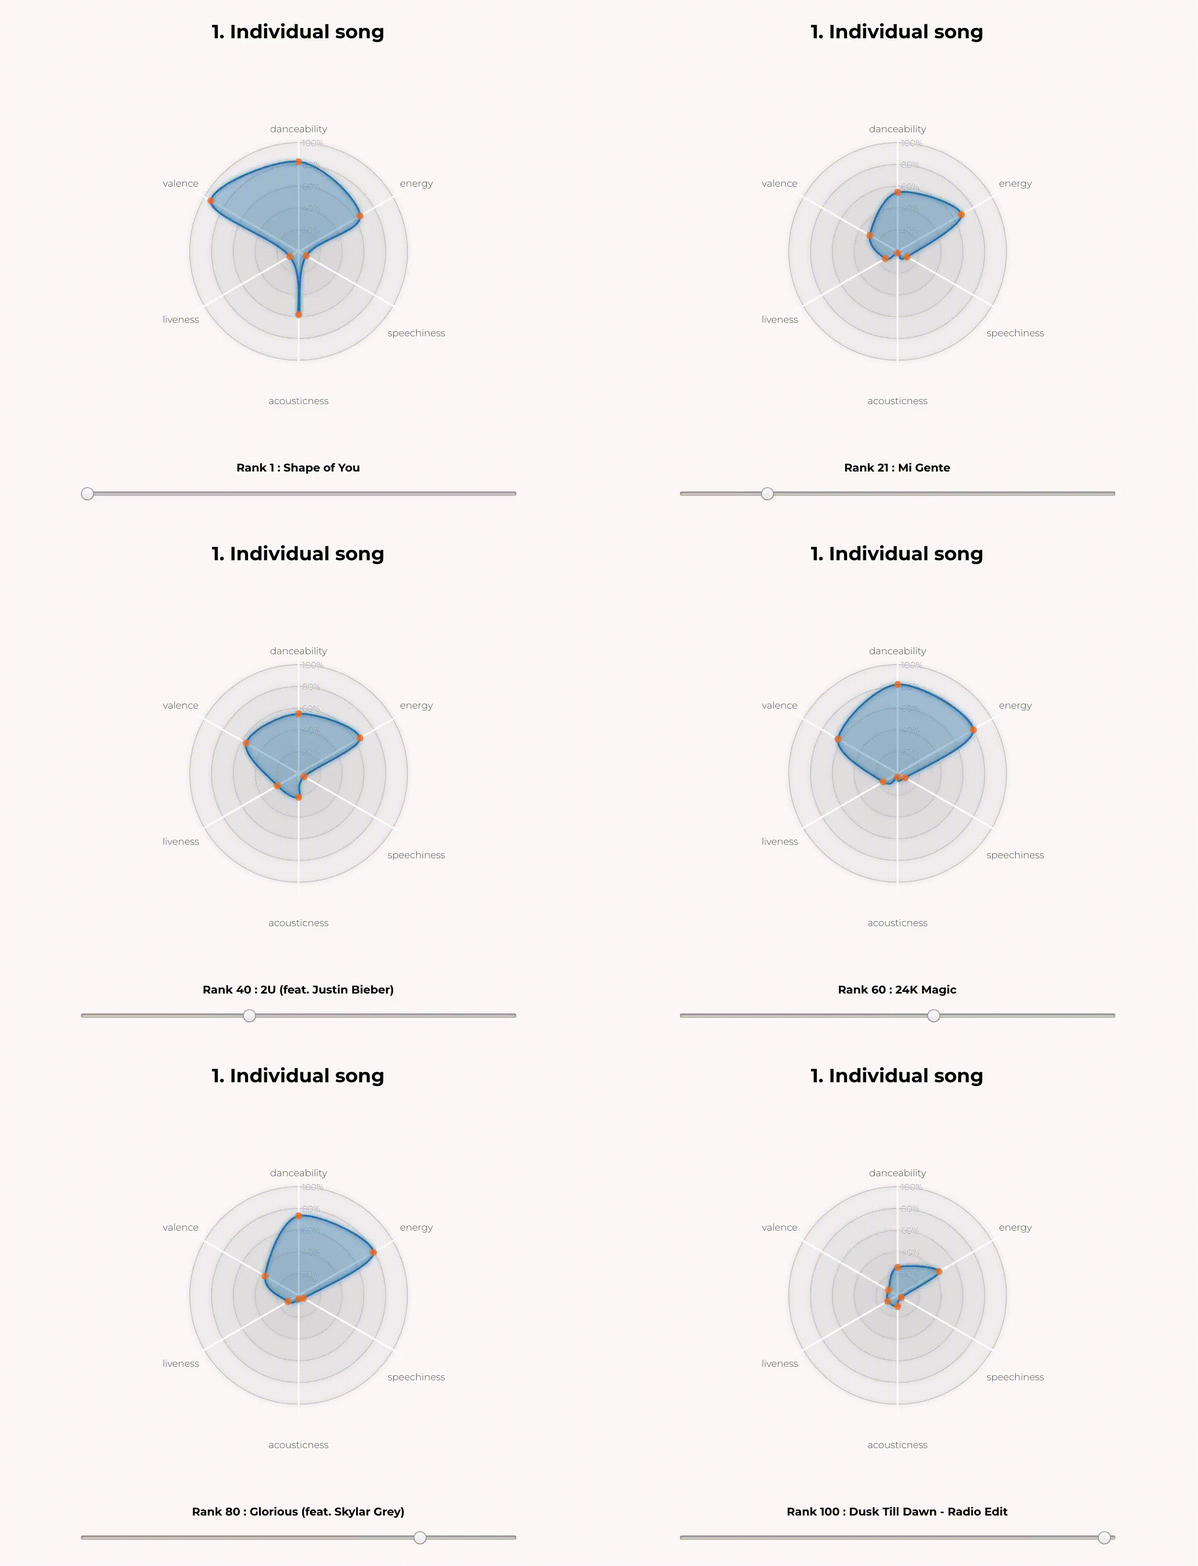
Now that the chart worked exactly the way I wanted it to, it was time to use it to elicit some insights. To do this, I decided to see what would happen if I overlapped multiple songs to find trends in the parameters. To prevent overcrowding, I started with only the top 10 ranked songs first.
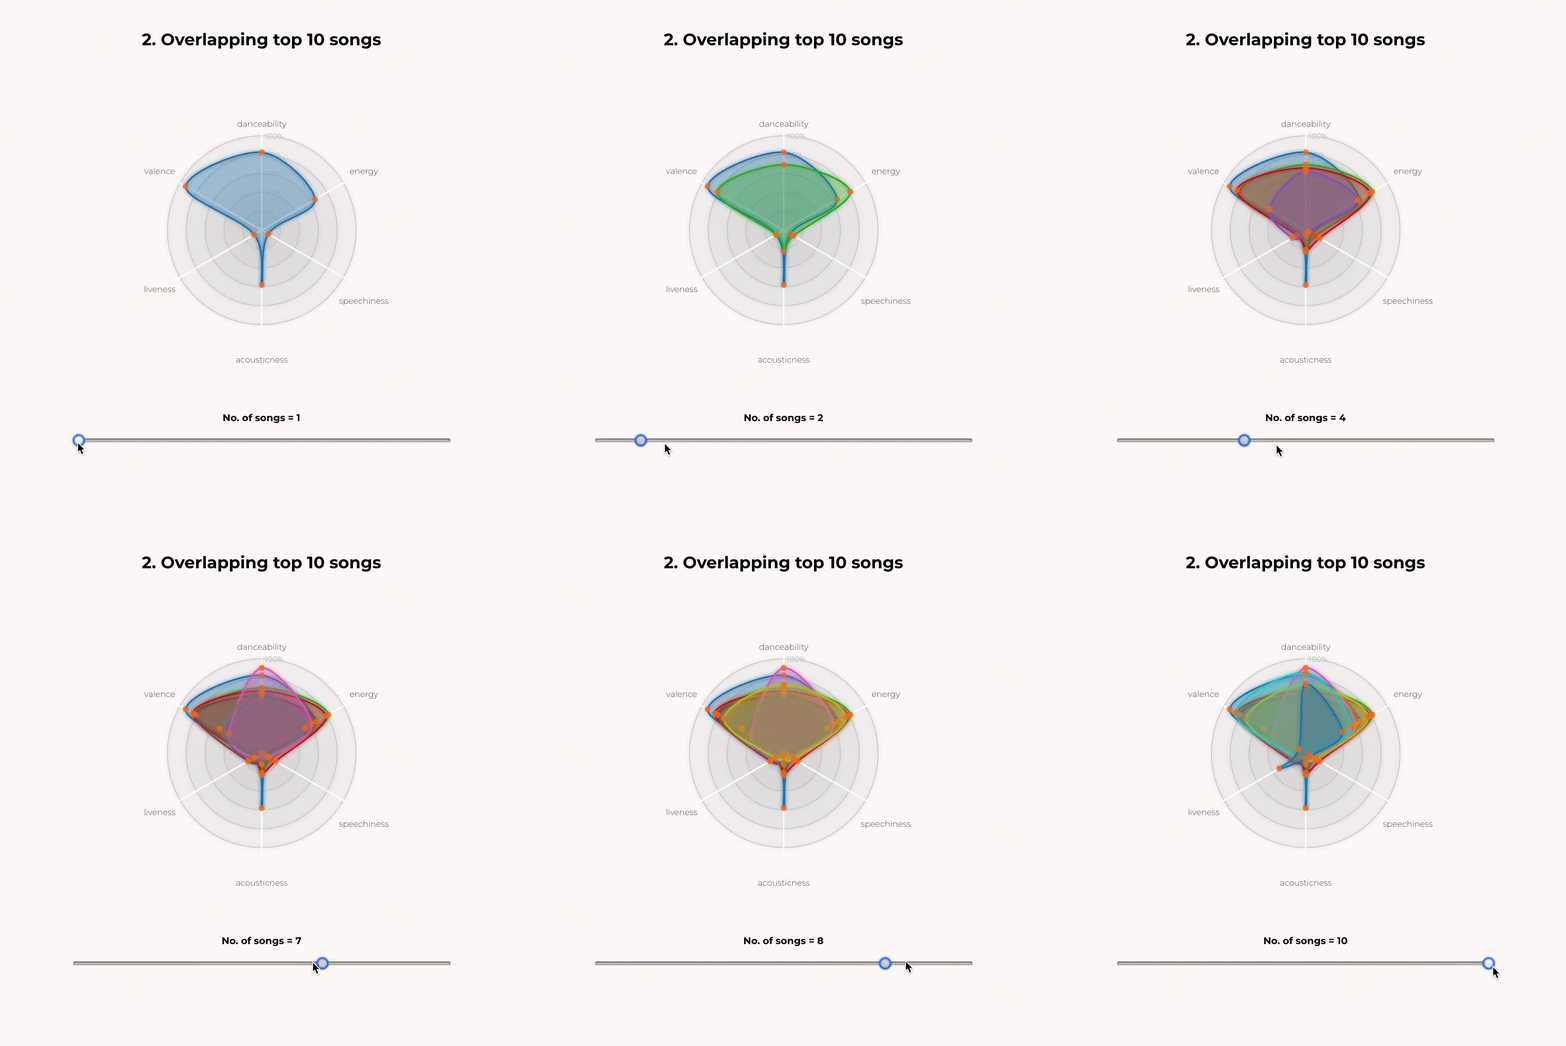
Initial Insights
You can already start seeing patterns emerging among the top 10 songs:
- All the top 10 songs are high on Danceability (above 60%)!
- Barring the Rank 1 song (Shape of You), all other songs are very low on Acousticness.
- All the top 10 songs are low on Liveness & Speechiness i.e. all the songs are recorded versions and have very few parts where there is more speech and less music.
- All songs are pretty mid to high energy (40-80%)
- Valence is pretty spread out.
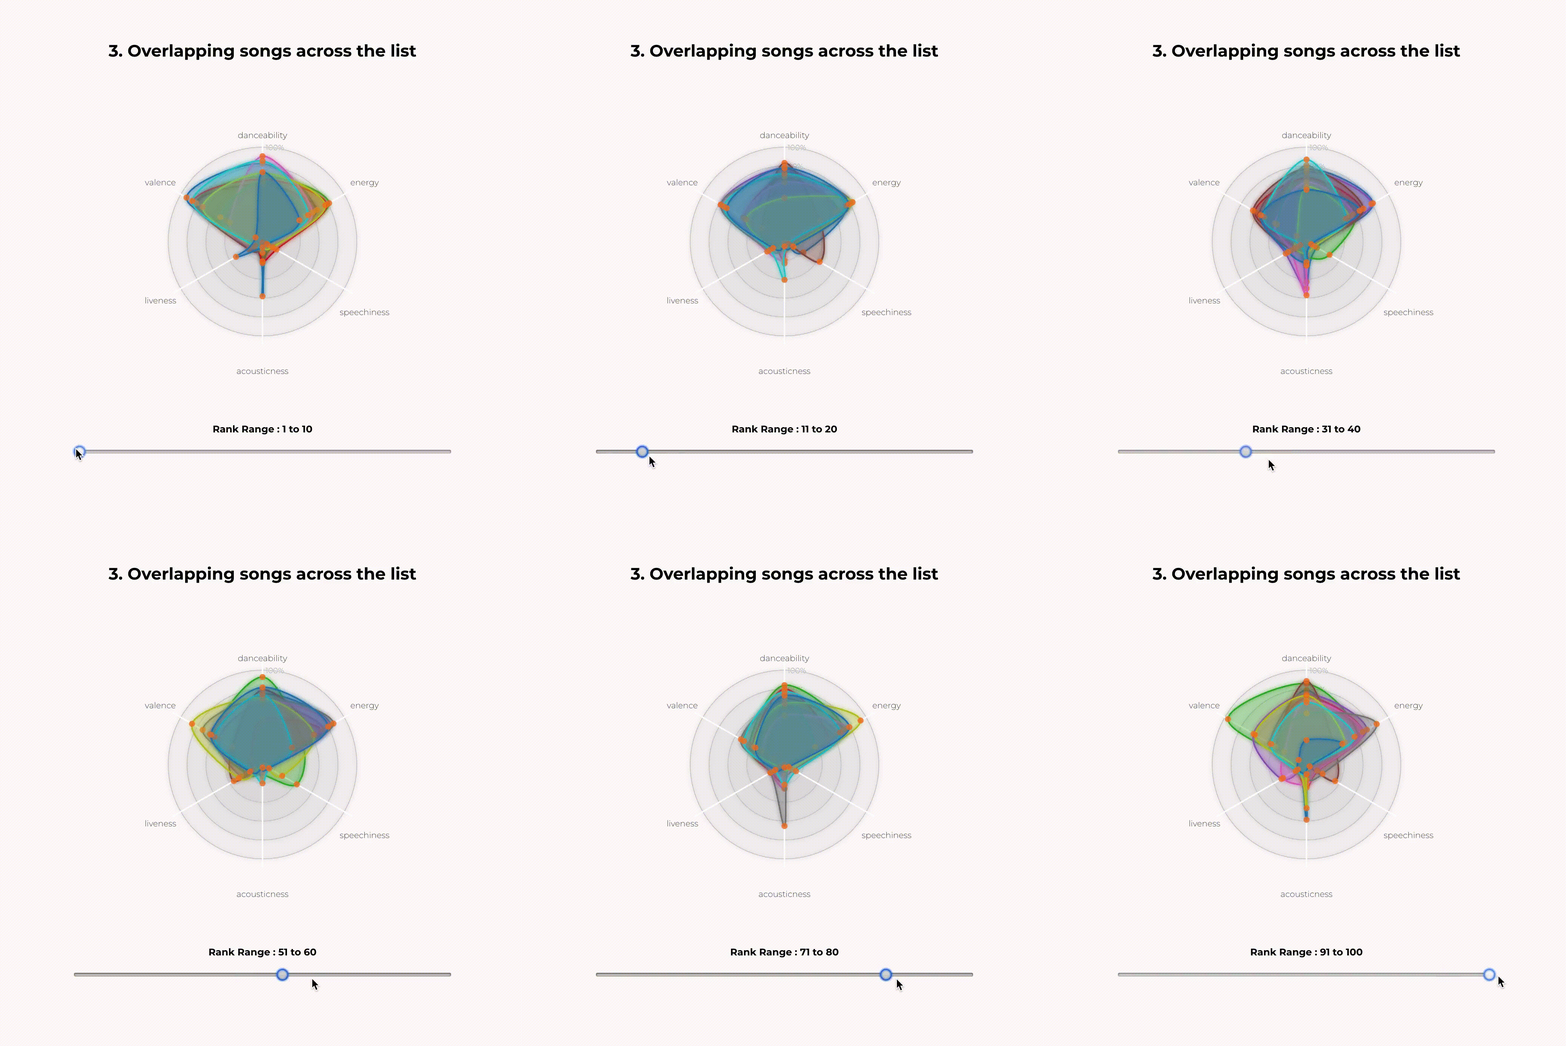
To expand on this I also created a way to see groups of 10 from Rank 1 to 100:
Final Insights
- Barring a few exceptions, Danceability still seems to have high values overall.
- Now we can see more songs that have higher Acousticness. But still not more than around 60–70%.
- Liveness and Speechiness are still unanimously low.
- Energy still seems to mid to high.
- Valence is still quite spread out but overall seems more prevalent in the mid to high region.
Conclusion
Want to make a hit song? To increase your odds, make it a high energy, electronic, dance number! Keep it on a simple 4/4 time signature, no need to complicate things. Try to keep the duration of the song around the optimal 3:20 minute mark. Make sure it’s recorded in a studio and not live, have vocals in your song but don’t make it too ‘speechy’, and wouldn’t hurt to make it high valence i.e. happy, cheerful, and/or euphoric.
You can view the final interactive visualization here
